The Harami Candle pattern
- Finquity+

- May 24, 2020
- 3 min read
It is a weekend and a good opportunity to take a break from the stock market and to learn something that would help you detect patterns on the charts and help you minimize your losses and maximize your profits.
Next in line are the Harami patterns that are very commonly seen on the charts. It is a two candlestick pattern and like the earlier ones have a bullish and a bearish variant. "Harami" is a Japenese word which means 'pregnant' since, the first candle is the continuation of the existing pattern and the second candle is the little belly sticking out in the opposite color. This makes the set of two candles look like a pregnant woman.
Bullish Harami Pattern
In a Bullish Harami pattern, the first candle is red in color following the earlier trend and the next one is a smaller red candle.

-The color here has its importance and the first candle should be red and the second green.
-In the next session, the candle opens higher than the previous session's close and closes lower than the previous session's open.
-The green candle should be smaller and completely engulfed by the red candle.
-Further, a third green candle would provide confirmation of the reversal of the trend.
-One has to keep in mind that, if the second candle is a Doji then it is called a 'Harami Cross' which is not reliable because it has a negligible body.
Pattern Psychology
A reversal in the pattern is seen as even after seeing a heavy day of selling (red candle) the next candle opens a bit higher than the previous close.
The investors who short sell panic seeing a higher open than the previous day forcing them to cover their shorts (buying back the shares) leading to a higher close resulting in a green candle.
This eventually leads to a change in the sentiments and investors are convinced that the trend has changed following a strong covering of shorts.
Example

Bearish Harami Pattern
Exactly opposite to the Bullish Harami Pattern, the first candle in this pattern is a green candle and the next smaller one is a red candle.

-After the first green candle, the next day it opens lower than the close of the previous session and closes lower than the previous session's open.
-The red candle should be smaller and engulfed by the previous candle.
As usual, a next red candle gives a confirmation and you can ride the trend.
-If the red candle is a Doji one, then the pattern can't be reliable, and reversal cannot be confirmed.
Pattern Psychology
An open lesser than the previous day's close even after a strong green candle triggers a profit booking strategy and price closes lower than the opening price.
The shorters now create a position in the market which leads to further selling resulting in a reversal in the trend.
Example

Piercing Pattern
This pattern can only be spotted in a downtrend and not in an uptrend pattern. It is a bullish pattern that indicates a reversal of the trend and indicates a bullish future.

-The body of the first candle is red and the second one is green (colors are of importance here)
- The green candle opens lower than the previous close but, a piercing pattern means a close of the same candle almost halfway up the prior candle.
- If the next day the prices move up with greater volumes showing a confirmation of bulls entering and reversal of the trend.
Pattern Psychology
There is already a bearish atmosphere resulting in a gapped down open in the next session. But during the trading session the bulls take over the bears, making the bears skeptical.
The bulls help the prices close at 50% of the previous red candle.
If the bulls continue in the market and the next candle opens higher with greater volumes a reversal in the trend is confirmed.
Example

Dark Cloud Pattern
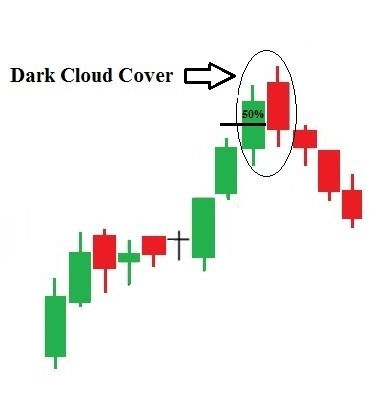
The Dark Cloud Pattern is opposite to the Piercing Pattern, which can be seen when an uptrend is about to end. Here is an example of a Dark Cloud Pattern.

-The body of the first candle is Green and the second one is Red, and the color is of importance.
-The red candle opens a bit higher than the previous close but closes halfway down the previous green candle. This would make a perfect Dark Cloud Pattern.
-Doji is a sign of confusion and hence is not a reliable candle.
Pattern Psychology
There is a bullish atmosphere resulting in a gap up the next day, however, during the session bears absorb the bulls.
The prices close at a level of 50% of the previous green candle.
If the next session witnesses higher volumes and higher prices, then there is a strong confirmation of the reversal.
Example

To learn more about technical analysis, Stay tuned!


Comments